Aruba Population Pyramid 1997
Aruba in 1997
In 1997, Aruba had a total population of 81,107 people. Over the previous ten years the population grew by 27.9%, up from 63,408 in 1987.
With a median age of 32.5 years, Aruba had a youth dependency ratio of 36.0 and an old-age dependency ratio of 9.3 per 100 people of working age. This is an expansive pyramid — each cohort of children is larger than the one above it, the signature of high birth rates and rapid growth.
Data source: United Nations World Population Prospects, 2024 revision (medium variant) — last updated July 2024.
In 2023 women in Aruba had on average 1.60 children, below the replacement level of 2.1.
Source: World Bank World Development Indicators, latest available year.
A child born there in 2023 could expect to live 76.4 years on average (78.8 years for girls, 73.7 for boys).
Source: World Bank World Development Indicators, latest available year.
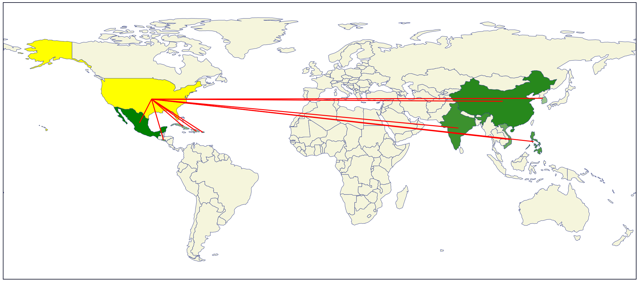
69,302 immigrants live in Aruba, 64.1% of the population.
| Venezuela | 23,312 |
| Colombia | 14,983 |
| Netherlands | 7,032 |
| Dominican Republic | 6,636 |
| Curaçao | 3,764 |
27,839 people born in Aruba live in other countries.
| Netherlands | 23,381 |
| Curaçao | 2,786 |
| United States Virgin Islands | 500 |
| Venezuela | 436 |
| Colombia | 381 |
Source: United Nations International Migrant Stock 2024.
| Country | Population | Median age | Relative size |
|---|---|---|---|
| Aruba | 81,107 | 32.5 | |
| Antigua and Barbuda | 71,053 | 27.4 | |
| Grenada | 105,294 | 24.7 | |
| United States Virgin Islands | 108,087 | 31.5 | |
| Saint Vincent and the Grenadines | 113,141 | 23.5 |