Costa Rica Population Pyramid 1986
Year
1986Costa Rica in 1986
As of 1986, Costa Rica counted 2,817,216 inhabitants. Over the previous ten years the population grew by 31.2%, up from 2,147,774 in 1976.
With a median age of 21.8 years, Costa Rica had a youth dependency ratio of 60.9 and an old-age dependency ratio of 7.0 per 100 people of working age. The broad-based, expansive shape of the pyramid points to high fertility and strong population growth.
Data source: United Nations World Population Prospects, 2024 revision (medium variant) — last updated July 2024.
The fertility rate of Costa Rica was 1.33 births per woman in 2023, under the 2.1 needed to replace each generation.
Source: World Bank World Development Indicators, latest available year.
Life expectancy at birth was 80.8 years in 2023: 83.4 for women and 78.1 for men.
Source: World Bank World Development Indicators, latest available year.
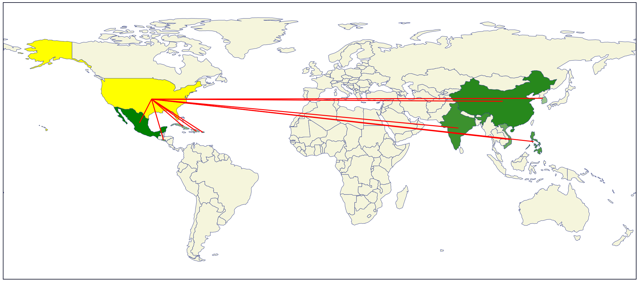
608,121 immigrants live in Costa Rica, 11.9% of the population.
| Nicaragua | 423,401 |
| Venezuela | 34,048 |
| Colombia | 30,809 |
| El Salvador | 20,131 |
| United States of America | 18,354 |
50,821 people born in Costa Rica live in other countries.
| Panama | 14,218 |
| Nicaragua | 11,707 |
| Canada | 5,117 |
| Mexico | 4,592 |
| Colombia | 2,070 |
Source: United Nations International Migrant Stock 2024.
| Country | Population | Median age | Relative size |
|---|---|---|---|
| Costa Rica | 2,817,217 | 21.8 | |
| Panama | 2,251,325 | 20.4 | |
| Nicaragua | 3,794,157 | 16.3 | |
| Honduras | 4,448,899 | 16.6 | |
| El Salvador | 4,992,769 | 18.4 |