Polynesia Population Pyramid 2066

Polynesia
2066
Population: 748,942

Year

-5 -1   2066  +1 +5

Country

A B C D E F G H I J K L M N O P Q R S T U V W Y Z
Embed this population pyramid ×

Copy the code below and paste it into your website or LMS.

Polynesia in 2066

By 2066, the population of Polynesia is expected to reach 748,942. Ten years before, in 2056, the projected population is 741,199 — 1.0% lower.

Half of the population would be younger than 37.6 years, with 19.9% children under 15 and 18.2% aged 65 or older. The near-vertical sides of the pyramid indicate a stationary age structure, with births roughly balancing the passage of cohorts into older age.

Share of the population by age group, 1950–2100

Data source: United Nations World Population Prospects, 2024 revision (medium variant) — last updated July 2024.

Population
748,942
Median age
37.6
0-14 %
19.9%
65+ %
18.2%
Child dependency
32.2
Old-age dependency
29.5
Pyramid shape
Births per woman

The World Bank does not publish this indicator for regions or continents.

Life expectancy at birth

The World Bank does not publish this indicator for regions or continents.

People supported per 100 workers
Dependency ratios, 1950–2100
Children Older adults
255075100
19502100
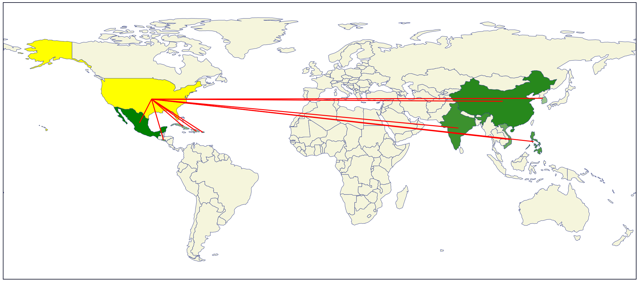
Where immigrants come from (2024)

61,061 immigrants live in Polynesia.

France23,312
Samoa16,397
New Zealand5,234
United States of America3,315
New Caledonia3,253
Where emigrants live (2024)

200,068 people born in Polynesia live in other countries.

New Zealand109,416
Australia69,153
New Caledonia13,041
Fiji2,158
Samoa1,456
Explore
Immigration statistics

Source: United Nations International Migrant Stock 2024.

What will the population of Polynesia be in 2066?
Polynesia is projected to have a population of 748,942 in 2066.
What is the median age in Polynesia?
Polynesia's median age is 37.6 years.
How many children and older people live in Polynesia?
In Polynesia, 19.9% of people are under 15 and 18.2% are 65 or older.
What type of population pyramid does Polynesia have?
Polynesia has a stationary pyramid: cohort sizes are roughly even through the younger ages, reflecting fertility close to replacement level.

Check our other visualizations