Saint Lucia Population Pyramid 2074
Year
2074Saint Lucia in 2074
By 2074, the population of Saint Lucia is expected to reach 142,621. That would be 8.9% less than in 2064 (156,626).
The median age is projected at 51.0 years, with 21.1 children under 15 and 55.3 people aged 65 or over for every 100 people of working age (15–64). The narrow base of the pyramid marks a constrictive age structure: fertility below replacement level and a rising share of older people.
Data source: United Nations World Population Prospects, 2024 revision (medium variant) — last updated July 2024.
In 2023 women in Saint Lucia had on average 1.38 children, below the replacement level of 2.1.
Source: World Bank World Development Indicators, latest available year.
A child born there in 2023 could expect to live 72.7 years on average (76.3 years for girls, 69.3 for boys).
Source: World Bank World Development Indicators, latest available year.
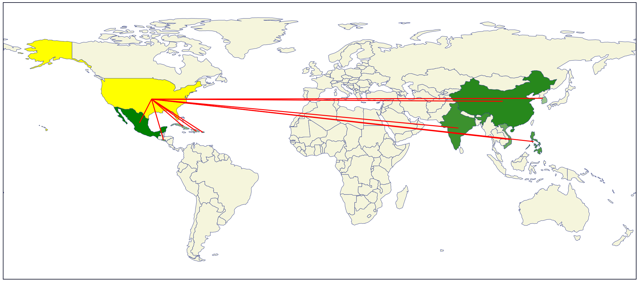
7,111 immigrants live in Saint Lucia, 4.0% of the population.
| Guyana | 2,045 |
| United States of America | 824 |
| United Kingdom | 735 |
| Trinidad and Tobago | 488 |
| Barbados | 390 |
20,101 people born in Saint Lucia live in other countries.
| Canada | 7,557 |
| United States Virgin Islands | 3,427 |
| Martinique | 2,242 |
| Barbados | 2,220 |
| Trinidad and Tobago | 1,406 |
Source: United Nations International Migrant Stock 2024.
| Country | Population | Median age | Relative size |
|---|---|---|---|
| Saint Lucia | 142,621 | 51.0 | |
| Curaçao | 151,060 | 53.7 | |
| Grenada | 97,224 | 52.3 | |
| Aruba | 87,520 | 48.5 | |
| Antigua and Barbuda | 83,554 | 51.1 |