Sao Tome and Principe Population Pyramid 1950
Year
1950Sao Tome and Principe in 1950
The population of Sao Tome and Principe in 1950 was 60,874. With a median age of 24.7 years, Sao Tome and Principe had a youth dependency ratio of 53.3 and an old-age dependency ratio of 6.2 per 100 people of working age.
The broad-based, expansive shape of the pyramid points to high fertility and strong population growth.
Data source: United Nations World Population Prospects, 2024 revision (medium variant) — last updated July 2024.
In 2023 women in Sao Tome and Principe had on average 3.64 children, above the replacement level of 2.1.
Source: World Bank World Development Indicators, latest available year.
A child born there in 2023 could expect to live 69.7 years on average (73.7 years for girls, 66.2 for boys).
Source: World Bank World Development Indicators, latest available year.
1,905 immigrants live in Sao Tome and Principe, 0.8% of the population.
| Cabo Verde | 1,115 |
| Angola | 292 |
| Gabon | 192 |
| Equatorial Guinea | 118 |
| Portugal | 95 |
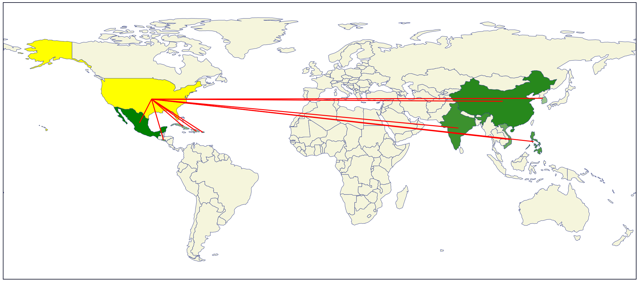
41,433 people born in Sao Tome and Principe live in other countries.
| Portugal | 23,121 |
| Angola | 7,062 |
| Gabon | 7,058 |
| Equatorial Guinea | 1,936 |
| Cabo Verde | 1,893 |
Source: United Nations International Migrant Stock 2024.
| Country | Population | Median age | Relative size |
|---|---|---|---|
| Sao Tome and Principe | 60,874 | 24.7 | |
| Equatorial Guinea | 226,563 | 23.5 | |
| Gabon | 472,842 | 28.1 | |
| Congo | 835,262 | 19.9 | |
| Central African Republic | 1,438,058 | 22.3 |