United States of America Population Pyramid 2073
United States of America in 2073
In 2073, the United States of America is projected to have a population of 401,080,532 people. Compared with 2063, when the projection stands at 391,545,618, that represents growth of 2.4% over ten years.
The median age is projected at 44.8 years, with 25.3 children under 15 and 44.8 people aged 65 or over for every 100 people of working age (15–64). The pyramid is constrictive: cohorts of children are smaller than those of their parents, reflecting low fertility and an ageing population.
The bulge of cohorts born between 1946 and 1964 — the post-war baby boom — is the defining feature of the United States pyramid, visible as it moves up the age scale over the decades.
Data source: United Nations World Population Prospects, 2024 revision (medium variant) — last updated July 2024.
The fertility rate of the United States of America was 1.62 births per woman in 2023, under the 2.1 needed to replace each generation.
Source: World Bank World Development Indicators, latest available year.
Life expectancy at birth was 78.4 years in 2023: 81.1 for women and 75.8 for men.
Source: World Bank World Development Indicators, latest available year.
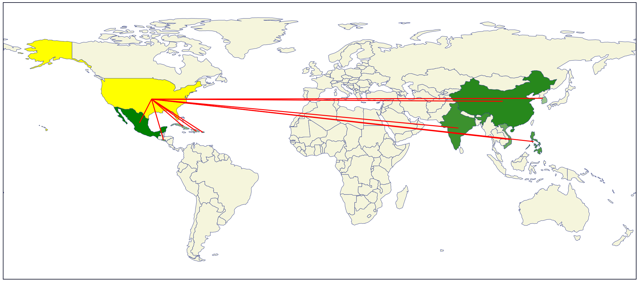
48,855,624 immigrants live in United States of America, 14.1% of the population.
| Mexico | 11,279,561 |
| India | 3,165,238 |
| China | 2,488,775 |
| Philippines | 2,263,697 |
| Puerto Rico | 1,924,799 |
3,168,477 people born in United States of America live in other countries.
| Mexico | 823,502 |
| Canada | 256,571 |
| United Kingdom | 243,570 |
| Germany | 152,501 |
| Puerto Rico | 144,149 |
Source: United Nations International Migrant Stock 2024.
| Country | Population | Median age | Relative size |
|---|---|---|---|
| United States of America | 401,080,533 | 44.8 | |
| Canada | 49,346,189 | 47.6 |